add-circle-bold add-circle add-square add alarm-bell-1 alert-diamond analytics-pie-2 archive archive arrow-down-1 arrow-down-2 arrow-left-1 arrow-right-1 arrow-up-1 attachment-1 bin-paper-1 book-star button-record check-1 check-circle-1 close close-quote close cog-1 cog common-file-stack copy-paste credit-card-1 diagram-fall-down disable time-clock-midnight download-thick-bottom drawer-send envelope-letter envelope-letter expand-6 expand-6 file-code filter-1 floppy-disk flying-insect-honey folder-file-1 headphones-customer-support hierarchy-9 hyperlink-2 information-circle keyboard-arrow-down keyboard-arrow-up layout-module-1 list-bullets lock-2 lock-unlock-1 love-it messages-bubble-square move-to-top multiple-circle multiple-neutral-1 multiple-users-1 navigation-menu-horizontal navigation-menu network-browser open-quote pencil-1 pencil-write pencil-1 print-text rating-star rating-star remove-circle remove-square-1 search send-email-1 shield-warning single-neutral-actions single-neutral smiley-sad-1 smiley-unhappy smiley-indifferent smiley-smile-1_1 smiley-happy smiley-sad-1 smiley-unhappy smiley-indifferent smiley-happy smiley-thrilled social-media-twitter synchronize-arrows-1 tags-double ticket-1 ticket-1 time-clock-circle undo view-1 view-off view wench

Understanding Funnel Stats vs. Stages Distribution

What is the difference between the Funnel Stats and the Stages Distribution Pie Chart in the Hitched Dashboard?
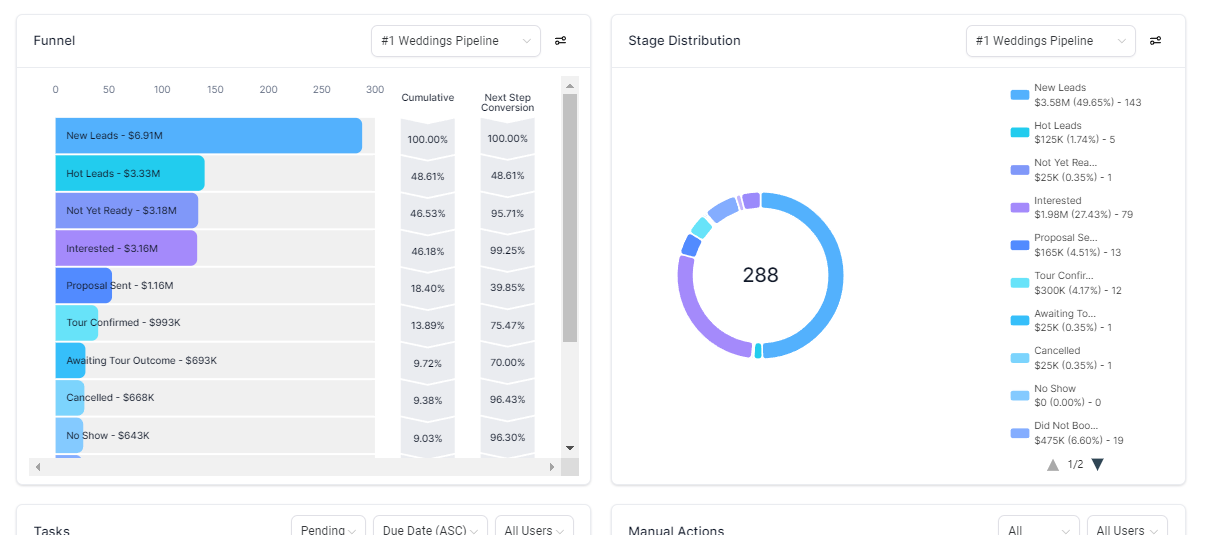
 

Funnel Stats:

The way we build our pipeline is like a sales stage. E.g. If we have a pipeline for stages like Elementary school, High school, University. If the person is in the University stage, we will increase the number of leads in the stage for Elementary and High school by 1 because we assume that the person has been to those stages.

So if you like to track the leads who are in the NO SHOW stage, it doesn't make sense to refer to the Funnel chart because even the leads that booked went through the NO SHOW stage. When the lead is marked as WON, the number of leads on all stages will be increased by 1 because we assume the lead went through all the steps to get to a booking.


Stages Distribution Pie Chart:

The pie chart simply shows the number of leads who are currently in which stages.